Answer Metrics (Dojo)
Read how your readers actually use Answers.
Answers ▸ Metrics in Dojo reports how your readers use Answers. Each panel is a chart, and every panel obeys the filters you set.
By default, Metrics shows the last three months.
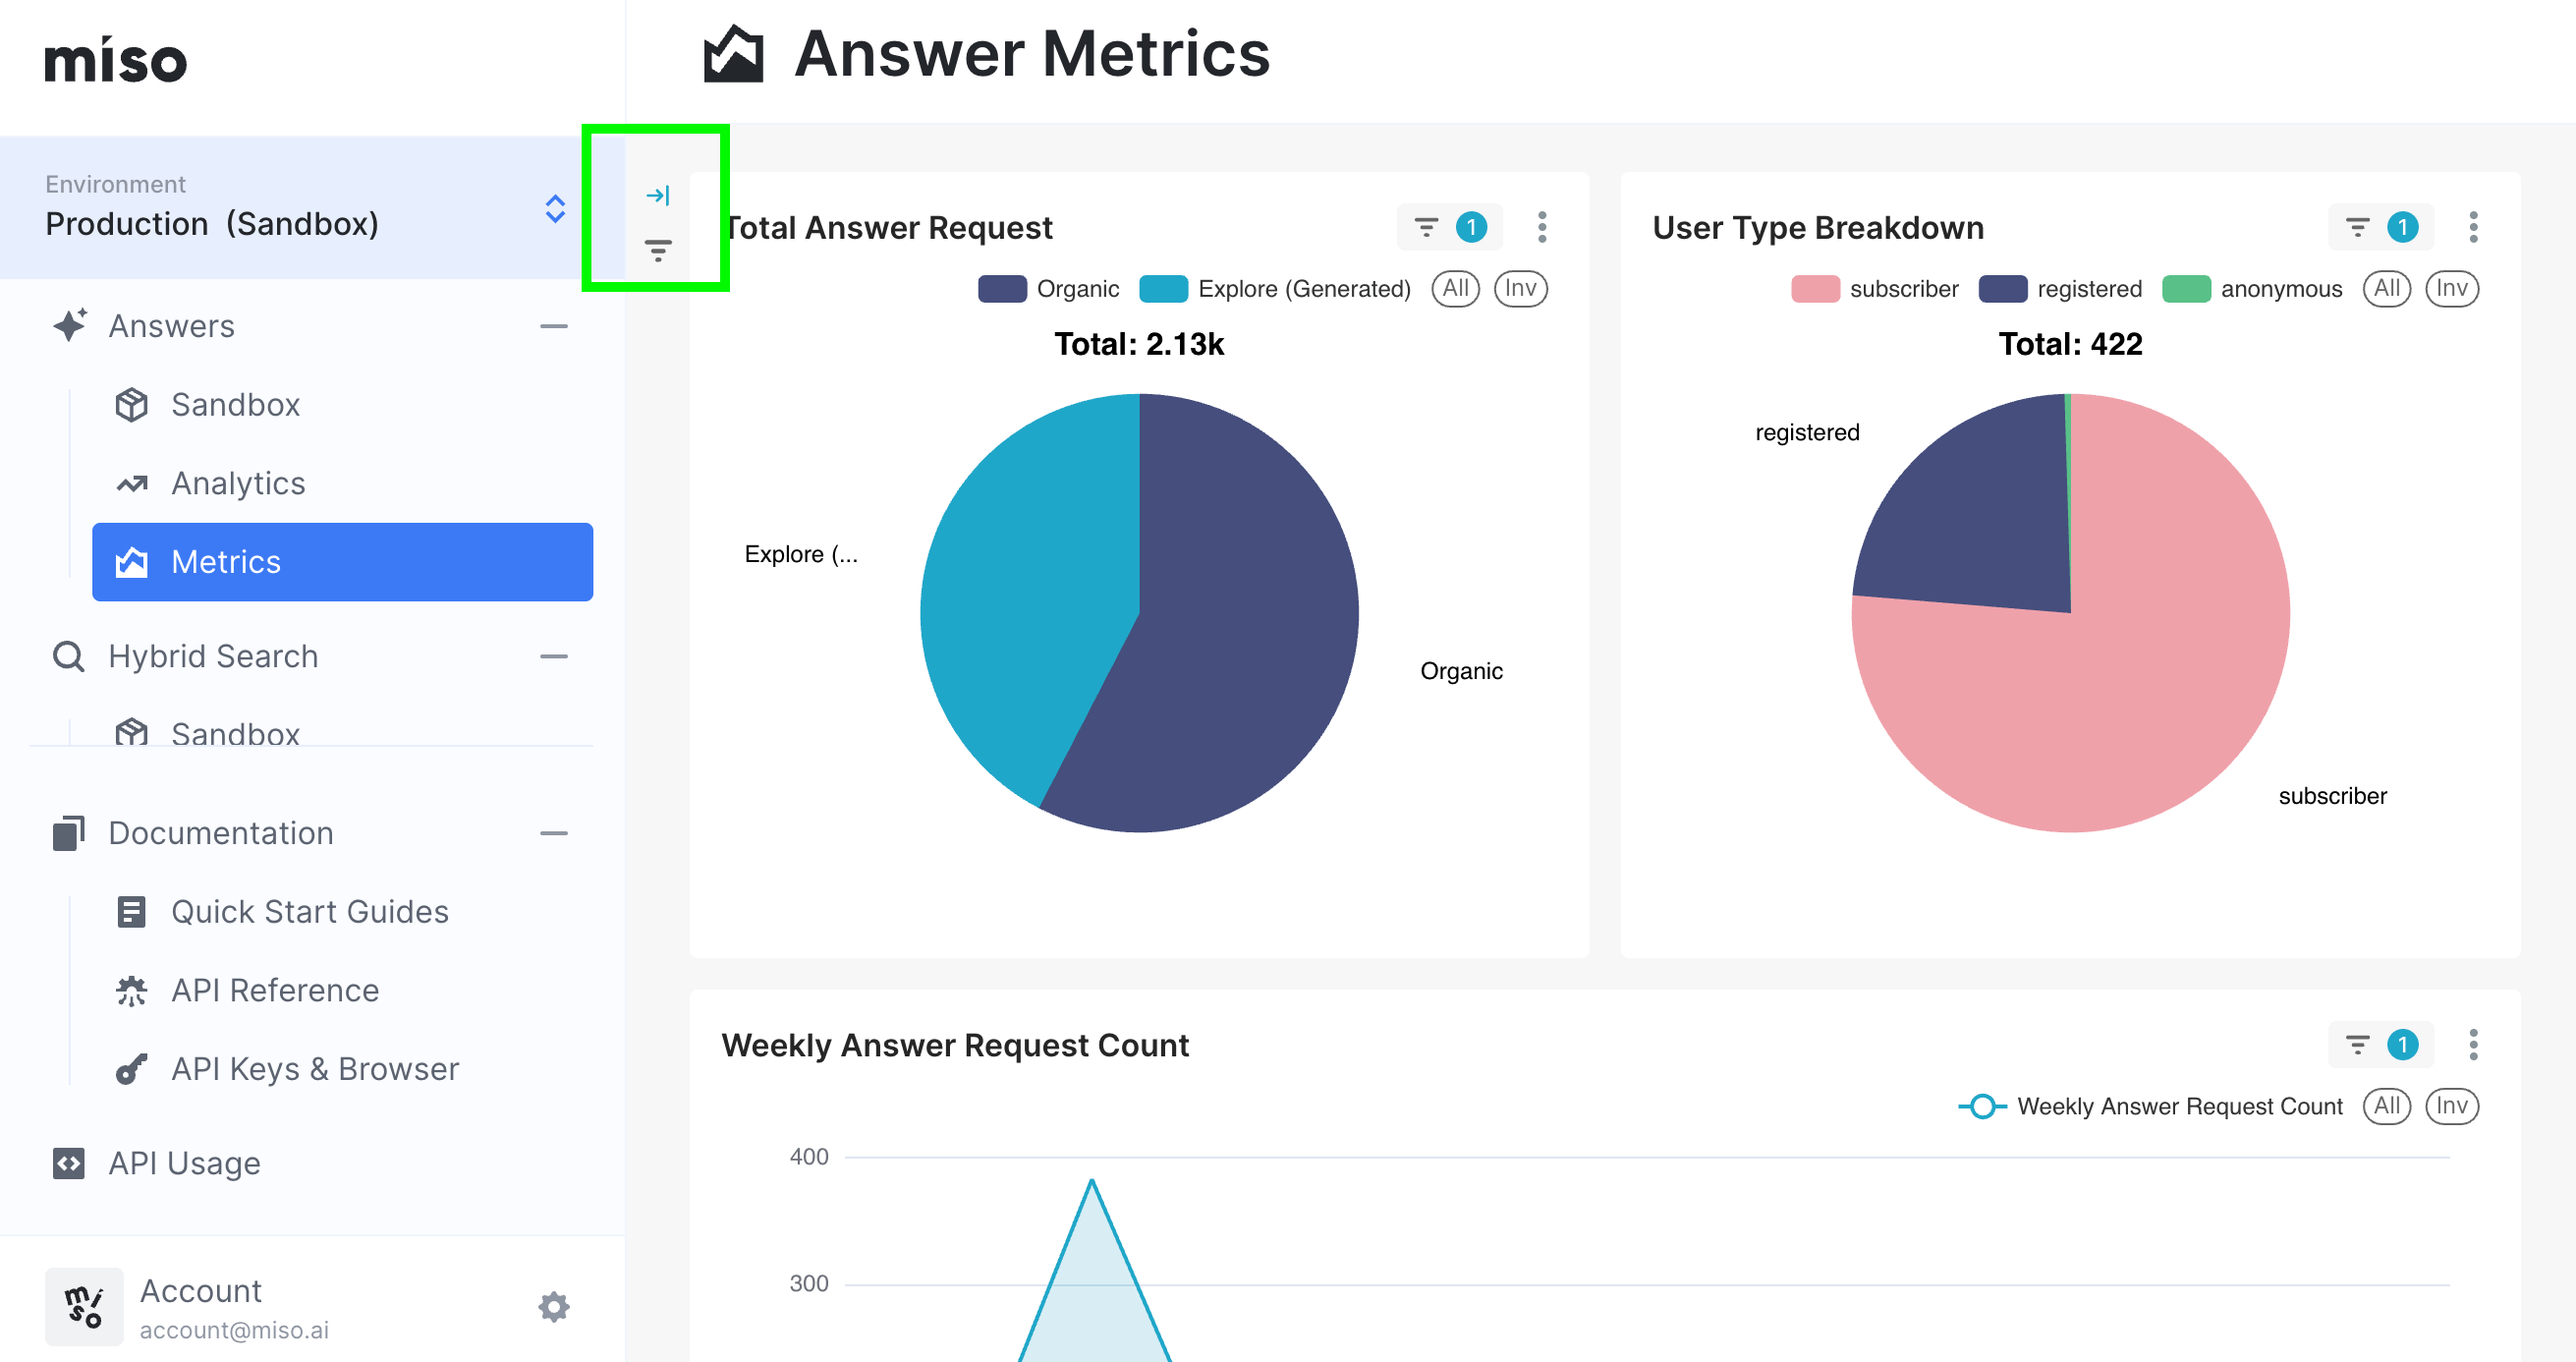
What the panels show
| Panel | What it counts |
|---|---|
| Total Answer Request | Every answer Miso produced, split by where the question came from. Organic is a question a reader typed. Explore (Generated) is a question Miso suggested and a reader clicked. |
| User Type Breakdown | The same answers, split by who asked: subscriber, registered, or anonymous. Miso reads the user type from the data you send. |
| Weekly Answer Request Count | Answers per week, so you can see the trend. |
The split between organic and generated questions is the useful one to watch. A high share of Explore questions means your suggested questions do their job. A high share of organic questions means readers arrive with their own.
User type needs your data. Miso can only report subscribers and registered readers if your site sends that value. See Integrating Your Data.
Change the time range
-
Select the filter button at the top left of the charts. The filter pane opens.
-
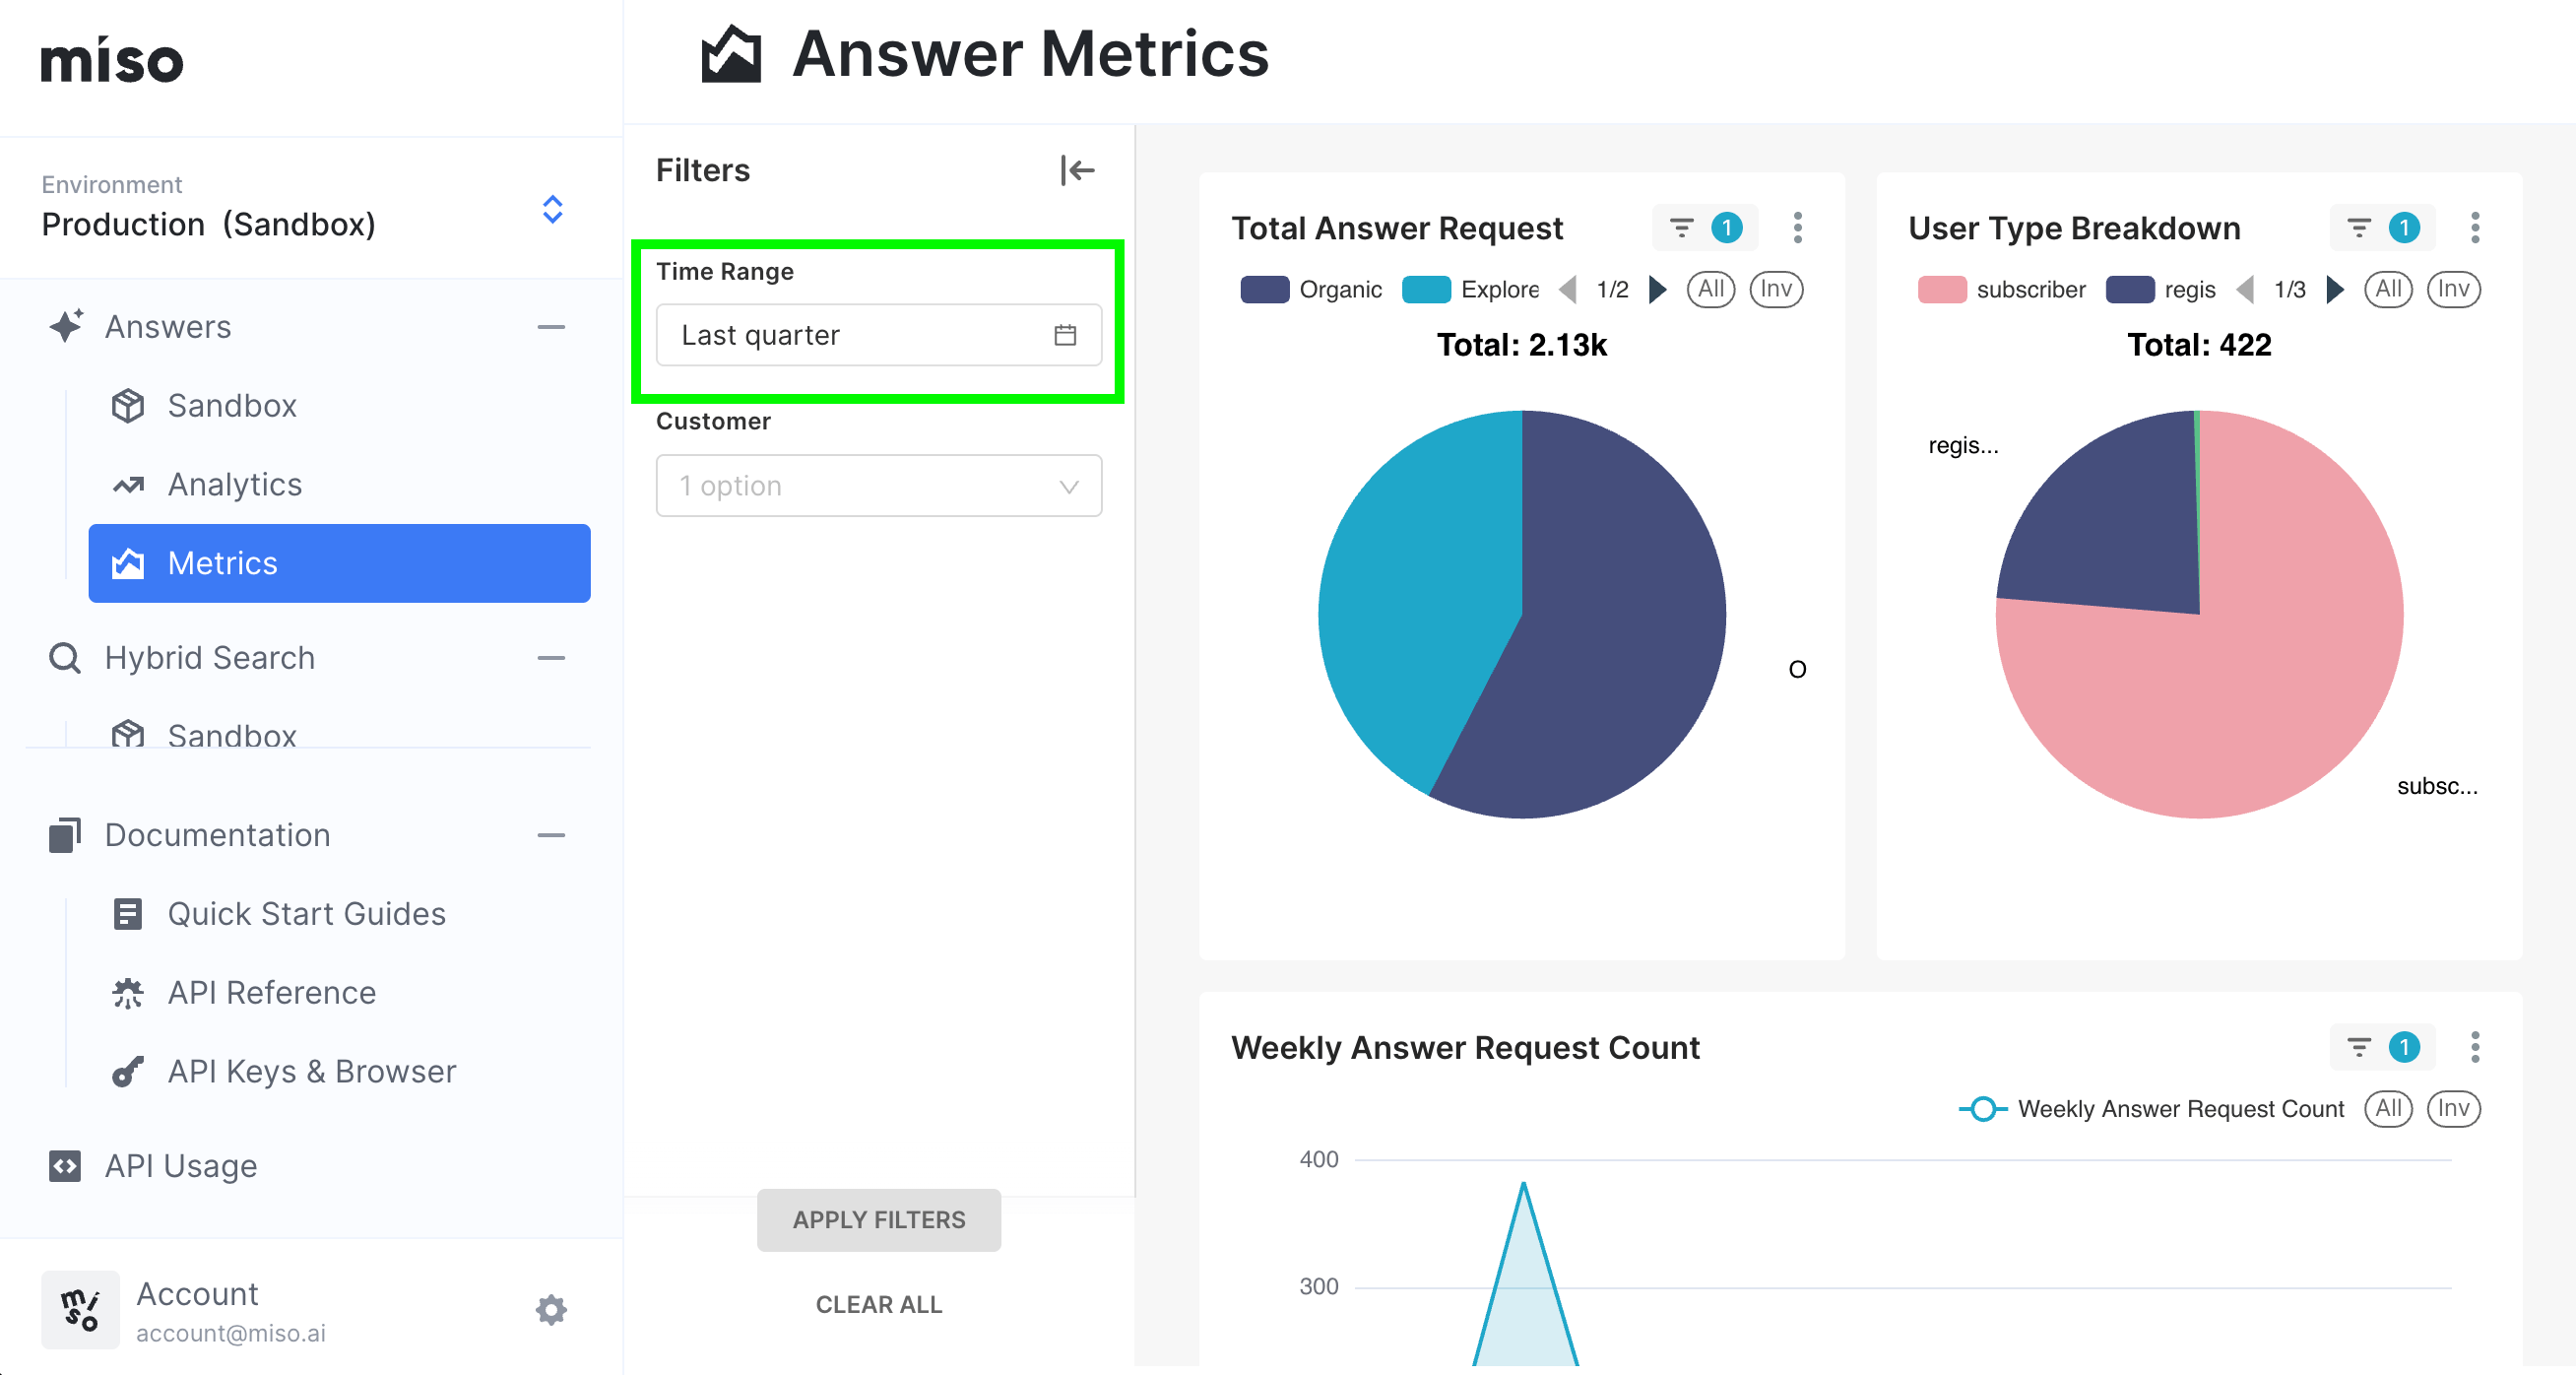
Select the Time Range field. The Edit time range window opens.
-
Set Range type.
Range type What it does Last A period that ends today, for example the last quarter. Previous The period before this one. Use it to compare. Custom A start and an end that you set. No filter All the data Miso holds. 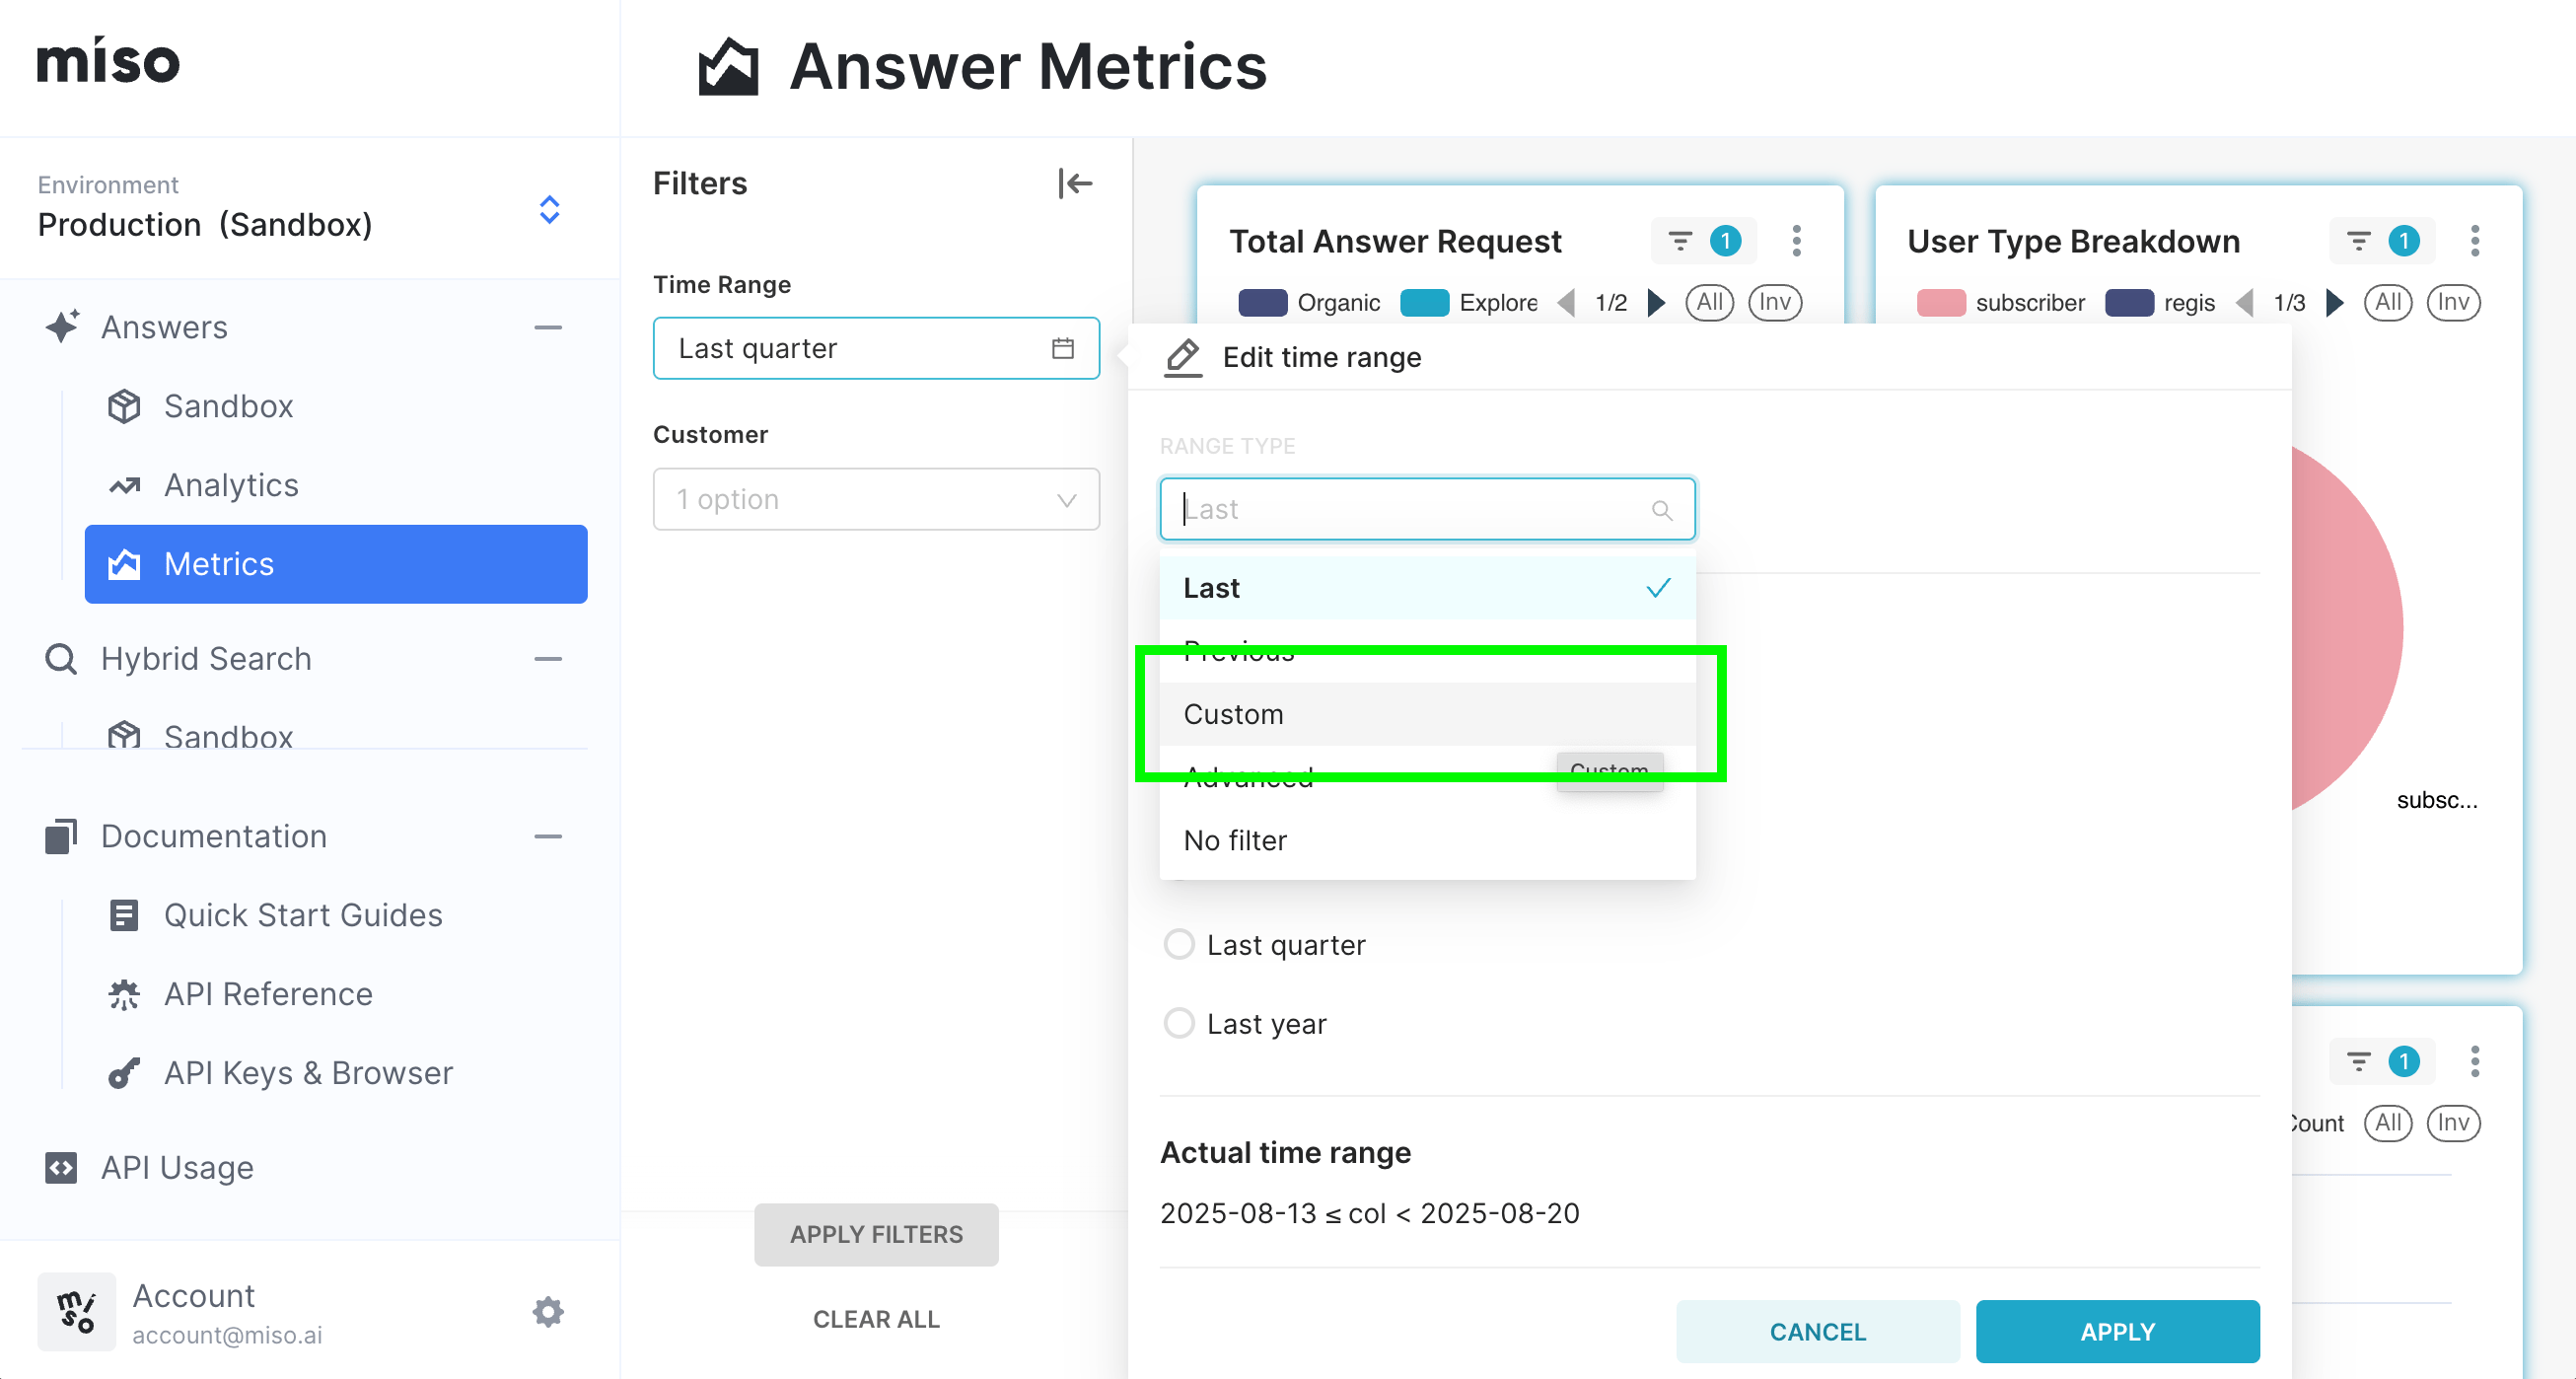
-
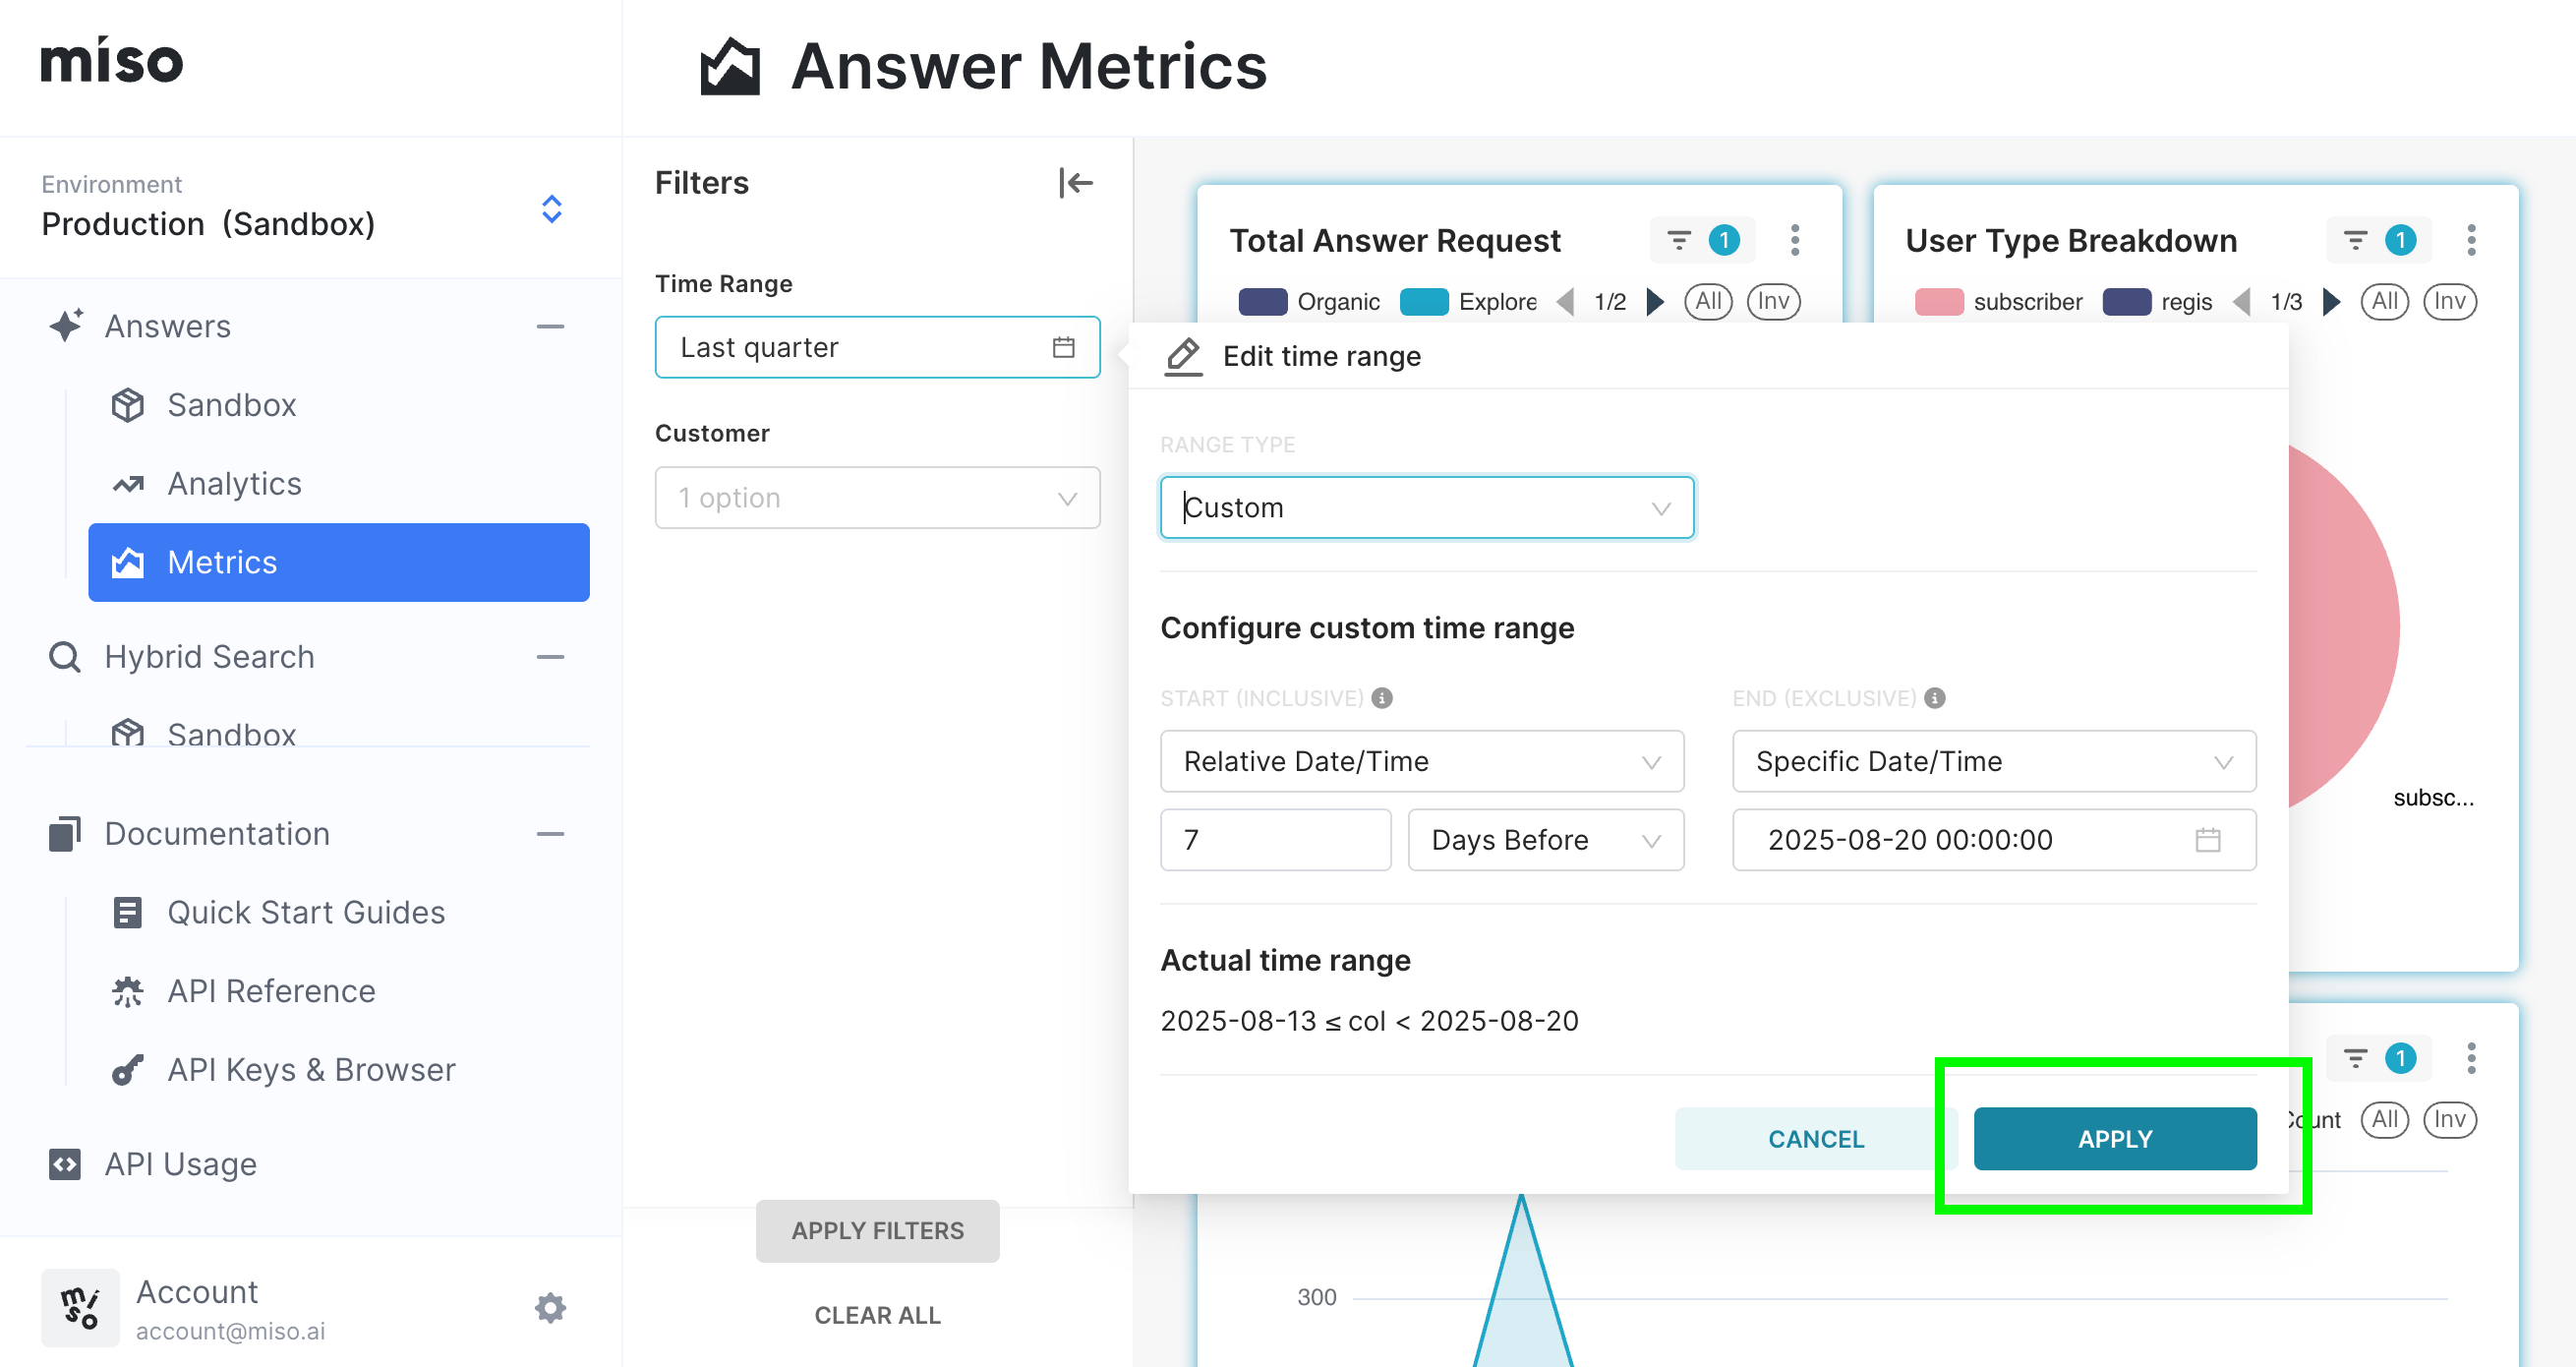
For a custom range, set the start and the end. Each one can be a specific date, or a date relative to today, such as 7 Days Before. The window shows the result under Actual time range. The start is inclusive and the end is exclusive.
-
Select Apply, then select Apply Filters in the filter pane.
Clear All returns every filter to its default.
Filter one panel
Each panel has its own filter button and its own legend. The filter button applies to that panel only. In the legend, All shows every series, and Inv inverts the selection. Use them to remove one series from a chart without a change to the other panels.
What Metrics does not show
Metrics reports volume and audience. For time to answer, refusal rates, click-through on sources, or Explore performance, ask your Miso representative for a report. Miso records all of it.